
Ethereum’s price action has transitioned into a stabilization phase after a strong reaction to this key demand zone shifted short-term sentiment. However, despite this rebound, the broader structure still reflects a market attempting to regain momentum while facing notable resistance overhead.
Ethereum Price Analysis: The Daily Chart
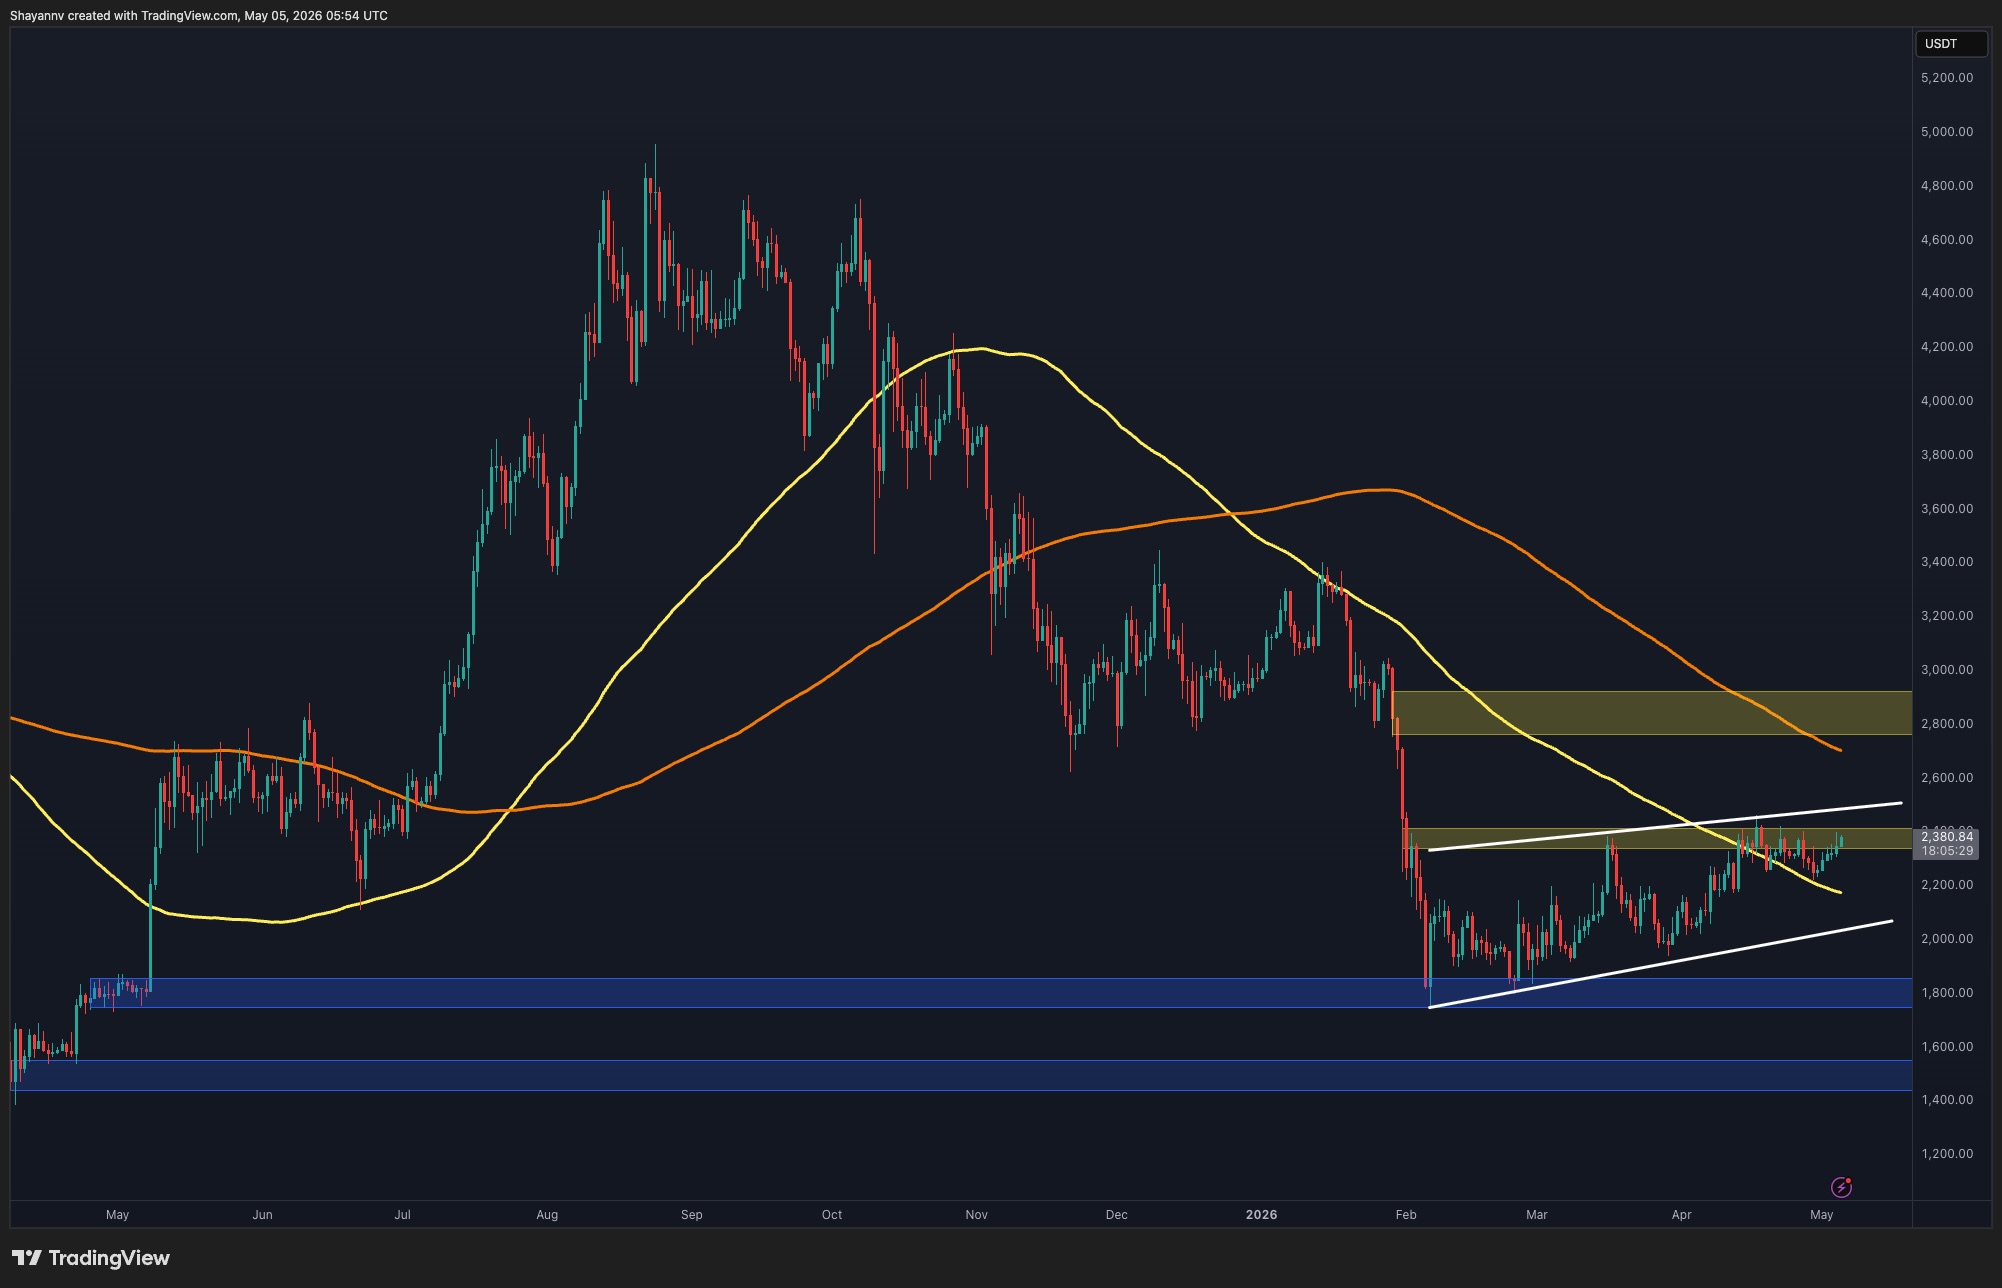
On the daily timeframe, ETH is clearly consolidating after establishing support at the critical $1.8K zone. This level has once again proven its significance, acting as a base for the current recovery phase. Since then, the price has been gradually pushing higher, but the upside remains capped by a confluence of resistance, including the upper boundary of the rising wedge structure and the key $2.4K supply zone.
This overlapping resistance area is currently limiting bullish continuation and forcing the market into a consolidation range. As long as Ethereum remains below this region, it is likely to continue fluctuating within a tightening structure. A decisive breakout above the $2.4K level and the wedge resistance would signal a shift in momentum and could trigger a fresh bullish leg toward higher price levels.
ETH/USDT 4-Hour Chart
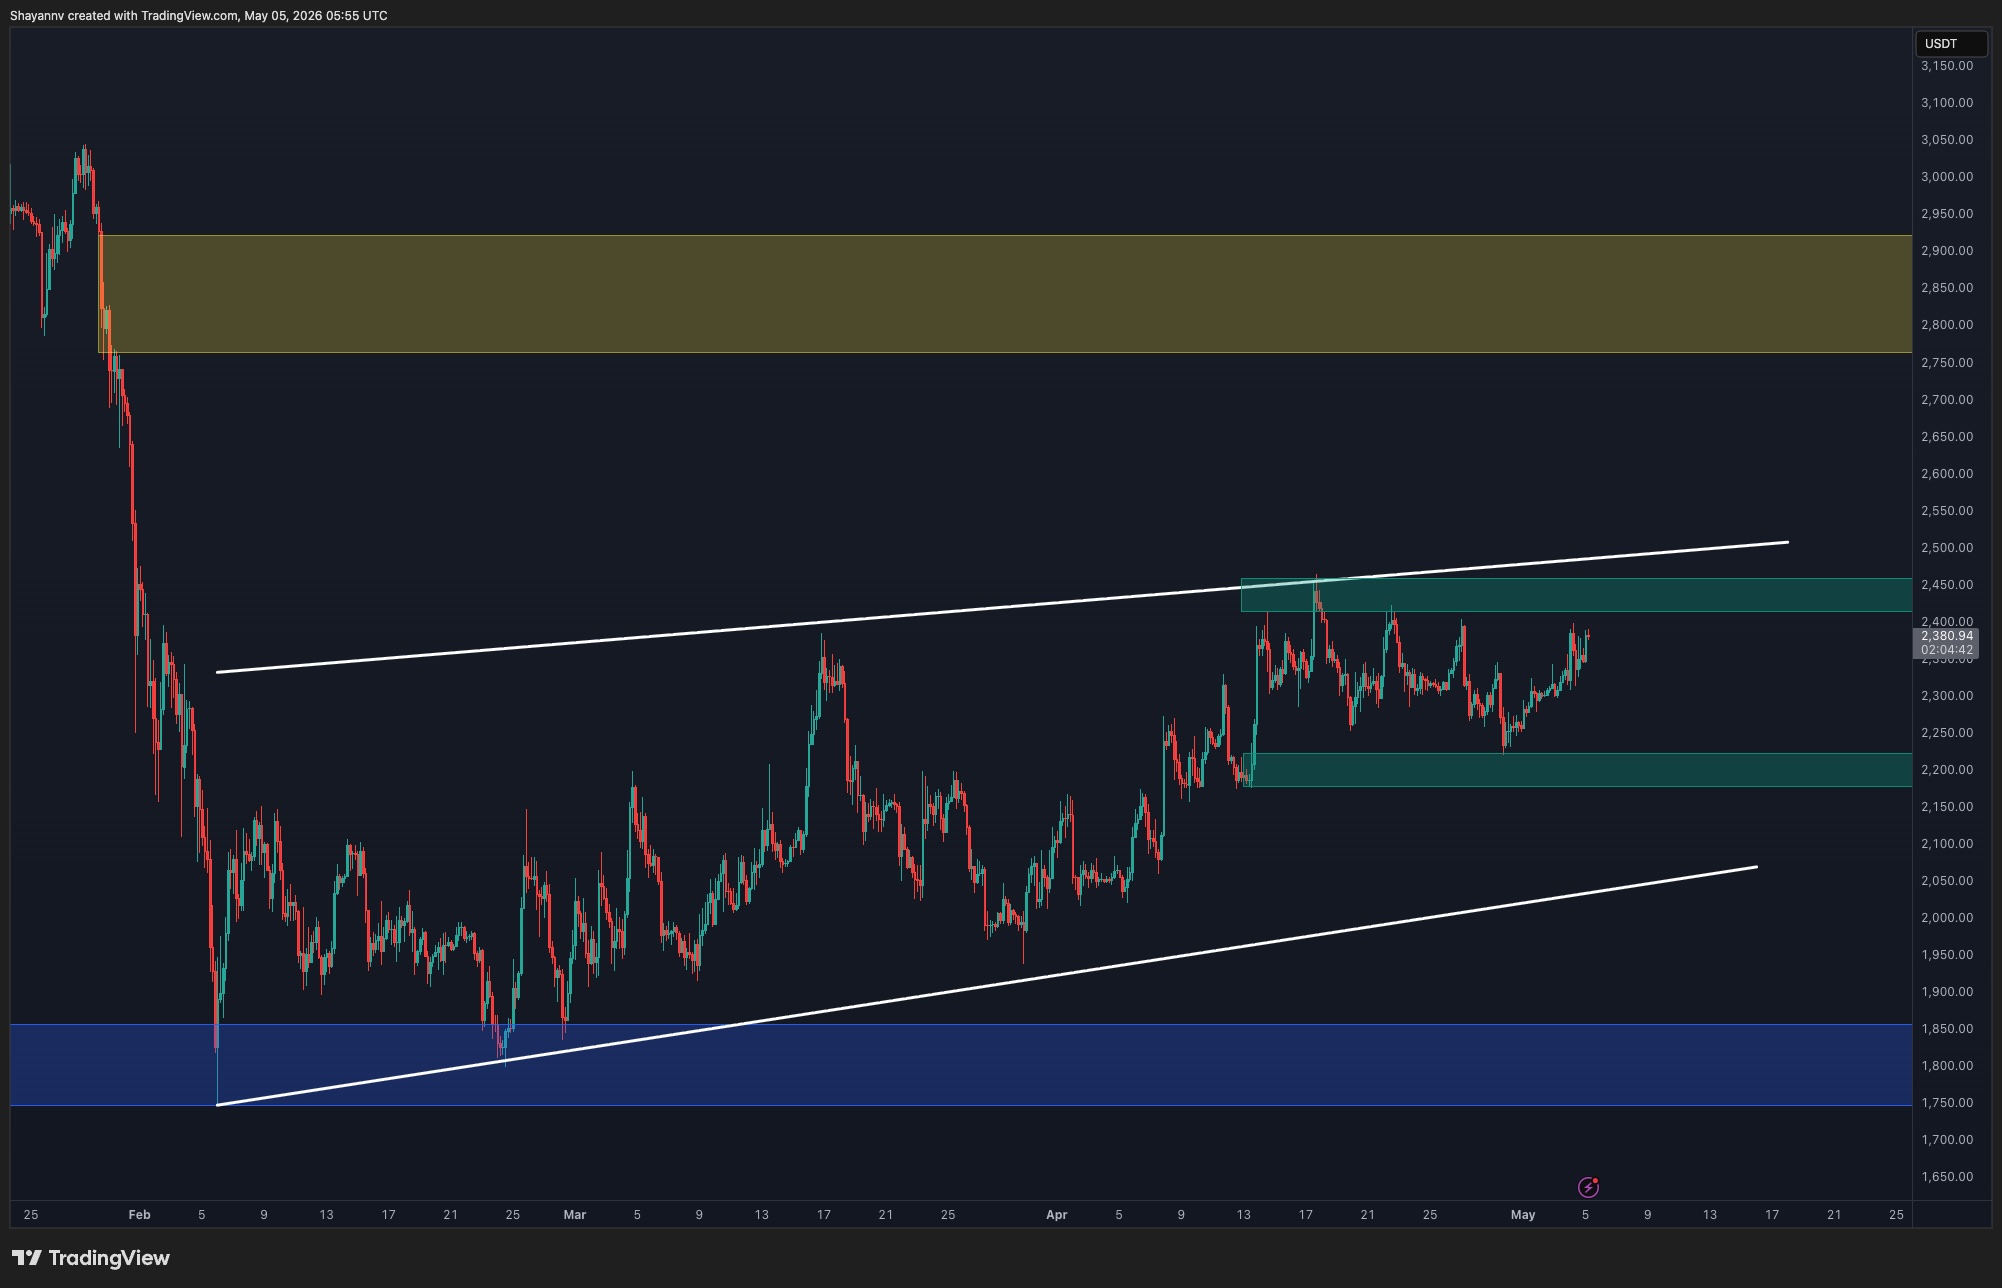
On the 4-hour chart, the price action is more compressed, forming a well-defined short-term range between the highlighted green support and resistance zones. ETH is currently oscillating within this narrow band, reflecting indecision among market participants. A breakout above the upper boundary of this range at $2.4K would likely lead to a continuation move toward the higher resistance cluster around the wedge’s upper boundary.
Conversely, a breakdown below the lower boundary could invalidate the short-term bullish structure and expose the market to another corrective move, potentially revisiting lower support levels. This local range effectively acts as a decision zone, where the next breakout will determine the short-term direction.
Sentiment Analysis
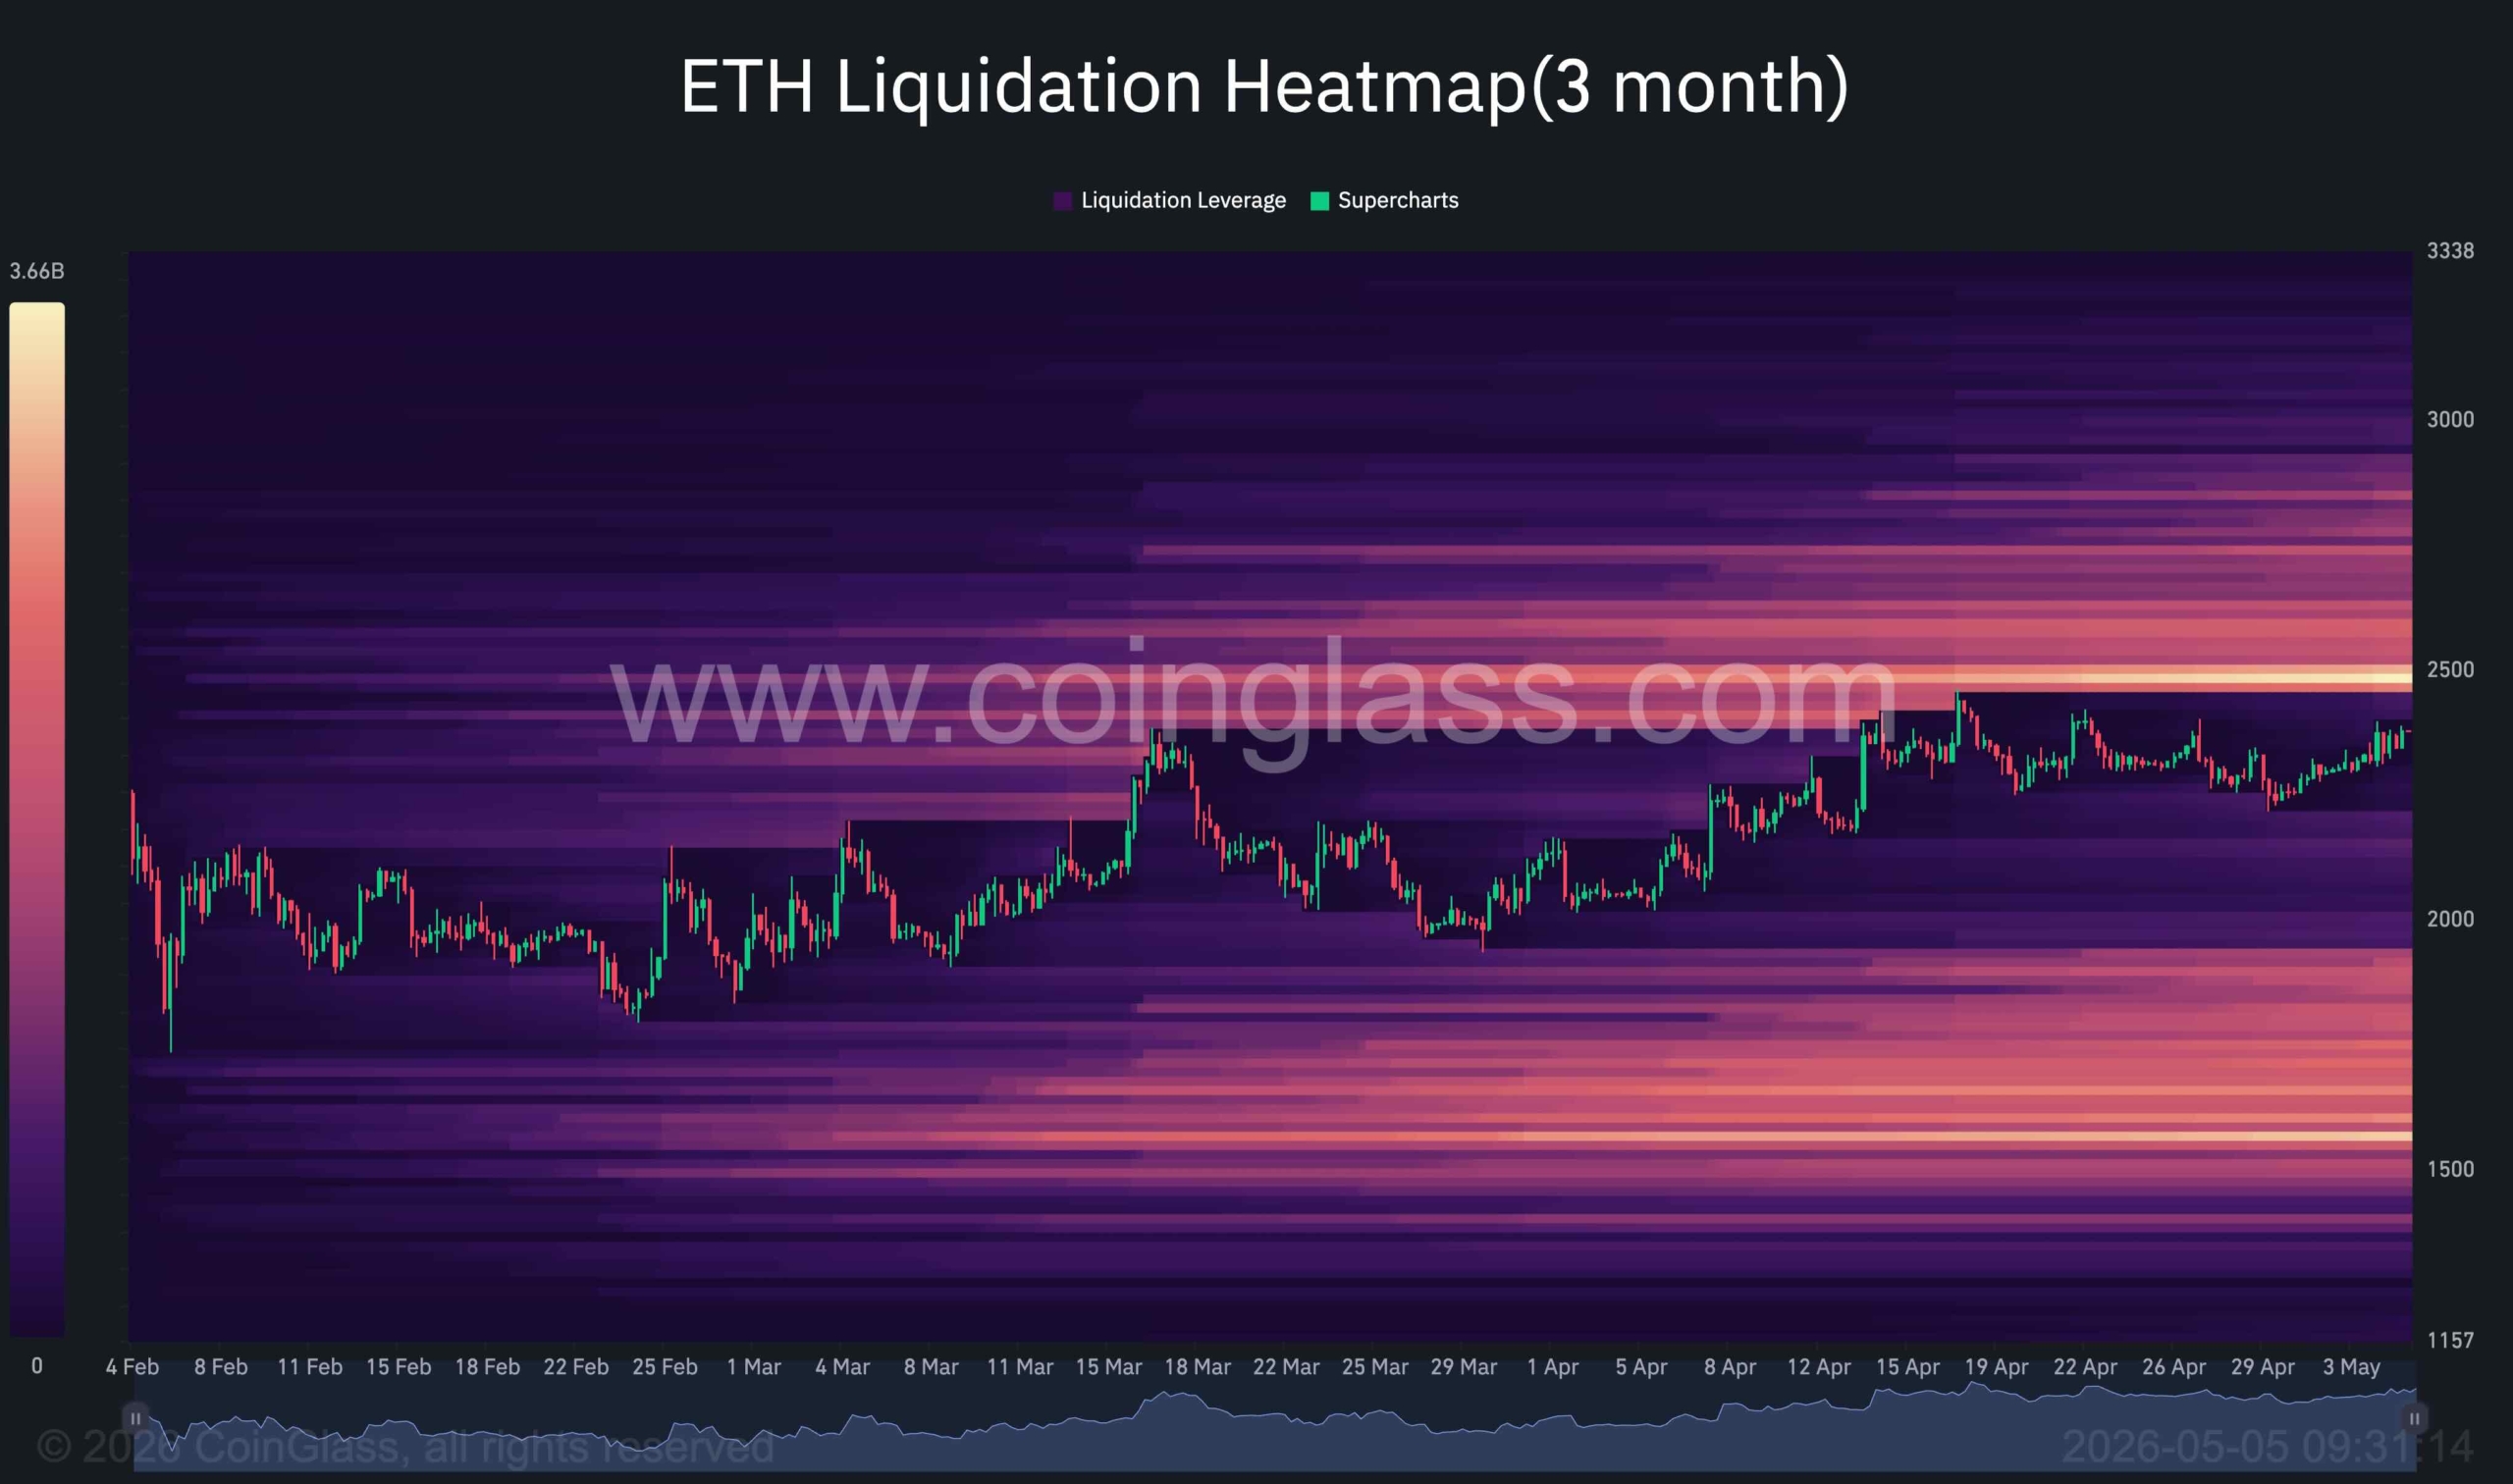
From a liquidity perspective, the heatmap reveals two major liquidity clusters that are likely to influence upcoming price movements. A significant concentration of liquidity is positioned above the current price around the $2.5K region, making it an attractive target for a potential short squeeze. At the same time, another notable liquidity pool exists below the $2K threshold, which could act as a magnet in the event of renewed bearish pressure.
This dual-sided liquidity structure suggests that Ethereum may first attempt to move higher toward the $2.5K region to capture upside liquidity before potentially reversing and targeting the lower liquidity zone near $2K. Such behavior would align with typical market dynamics, where the price seeks to exploit both sides of the order book before establishing a sustained trend.
Overall, Ethereum remains in a consolidation phase within a broader recovery structure, but the presence of strong overhead resistance and balanced liquidity distribution suggests that volatility expansion is approaching. The interaction between the $2.4K resistance, the short-term range boundaries, and the liquidity clusters will likely define the next significant move.
Prefer CryptoPotato on Google News – Never miss a breaking move
Binance Free $600 (CryptoPotato Exclusive): Use this link to register a new account and receive $600 exclusive welcome offer on Binance (full details).
LIMITED OFFER for CryptoPotato readers at Bybit: Use this link to register and open a $500 FREE position on any coin!
Disclaimer: Information found on CryptoPotato is those of writers quoted. It does not represent the opinions of CryptoPotato on whether to buy, sell, or hold any investments. You are advised to conduct your own research before making any investment decisions. Use provided information at your own risk. See Disclaimer for more information.
